5 defined-risk option setups lead the Jul 10, 2026 board
NFLX 7/24 76/77 Call Credit Spread ranks first with a 52.76 score, 64.7% modeled probability of profit and $70.00 maximum one-lot risk. The basket balances 1 bullish and 4 bearish expressions.
The option board is not rewarding indiscriminate beta. Across the published names, the mean five-session move is -0.8%, while 0 setups carry realized volatility above 65%. That combination favors defined-risk structures and hard entry limits over naked premium exposure.
The screen quotes 105 liquid underlyings and requests 40 option chains through its core, mover, volume and rotation sleeves. It accepts only same-session chains with two usable legs, then forces every idea through the same conservative mark: pay the ask for the long option and receive the bid for the short. The resulting ranking is intentionally harsher than a midpoint screen, because a trade that only works at a theoretical fill is not a durable public idea.
Direction comes from five- and twenty-session price structure rather than a headline guess. That keeps the daily board responsive to what is actually trading while the scenario engine still reserves room for jumps, volatility expansion and path-dependent failure. The result is a short list, not a promise that every liquid ticker deserves a trade.
Top score52.76
Avg. probability56.7%
Basket max risk$399
Data as ofJul 11, 6:38 AM EDT
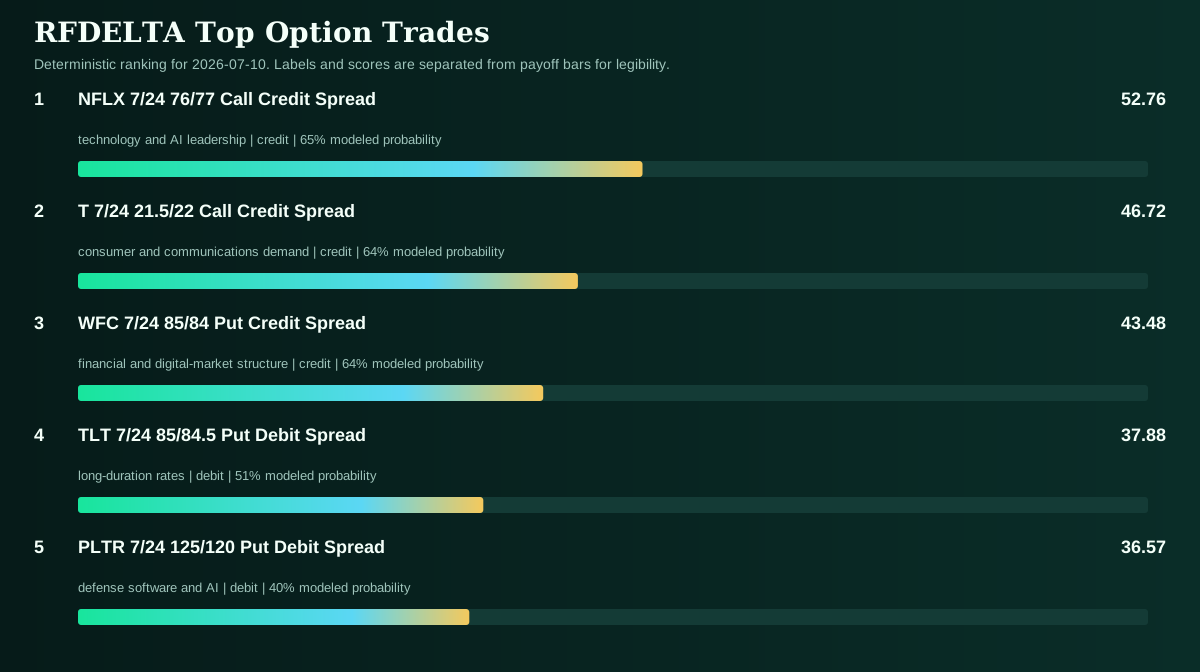
Ranked opportunity set
What leads the board
Every score combines four payoff views, conservative expected value, liquidity, session follow-through and multi-session alignment.
1. NFLX call credit52.76
NFLX 7/24 76/77 Call Credit Spread
2. T call credit46.72
T 7/24 21.5/22 Call Credit Spread
3. WFC put credit43.48
WFC 7/24 85/84 Put Credit Spread
4. TLT put debit37.88
TLT 7/24 85/84.5 Put Debit Spread
5. PLTR put debit36.57
PLTR 7/24 125/120 Put Debit Spread
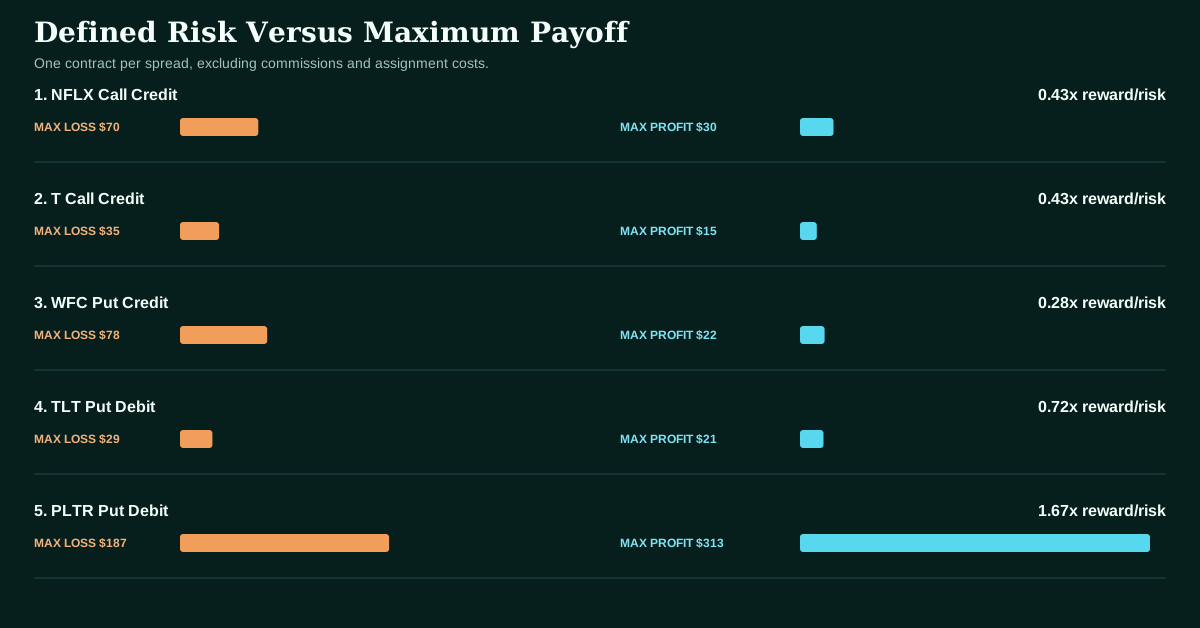
Payoff discipline
Risk is known before the trade
Maximum loss and maximum profit are shown for one vertical spread using conservative entry prices.
1. NFLX call credit0.43x
Max loss $70
Max profit $30
2. T call credit0.43x
Max loss $35
Max profit $15
3. WFC put credit0.28x
Max loss $78
Max profit $22
4. TLT put debit0.72x
Max loss $29
Max profit $21
5. PLTR put debit1.67x
Max loss $187
Max profit $313
Detailed trade intelligence
Trades 1-5
1
Actionable watch | technology and AI leadership
NFLX 7/24 76/77 Call Credit Spread
RFDELTA score52.76
Credit entry0.30
Prob. profit64.7%
Max loss$70.00
Max profit$30.00
Breakeven$76.30
Reward / risk0.43x
Why it ranks
The setup scores 52.76 on the common scale, supported by 64.7% modeled probability of profit, 0.95 liquidity quality and a conservative modeled expectancy of -$4.51, which keeps sizing discipline central.
NFLX enters with -5.5% five-session momentum and -10.5% over twenty sessions. Realized volatility is 41.9%, placing the underlying in a risk off regime. The bearish structure expresses that tape without allowing the loss to expand beyond the spread debit or defined credit width.
Trade construction
Buy the 77 call and sell the 76 call, both expiring Jul 24, 2026. The credit mark of 0.30 assumes the long ask and short bid, not a midpoint. Do not accept less than 0.30 of credit without rerunning the payoff.
Maximum one-lot profit is $30.00, or 0.43 times maximum risk. The simulation assigns 63.4% probability to finishing near maximum profit and uses 60.5% implied volatility across deterministic jump-stress paths.
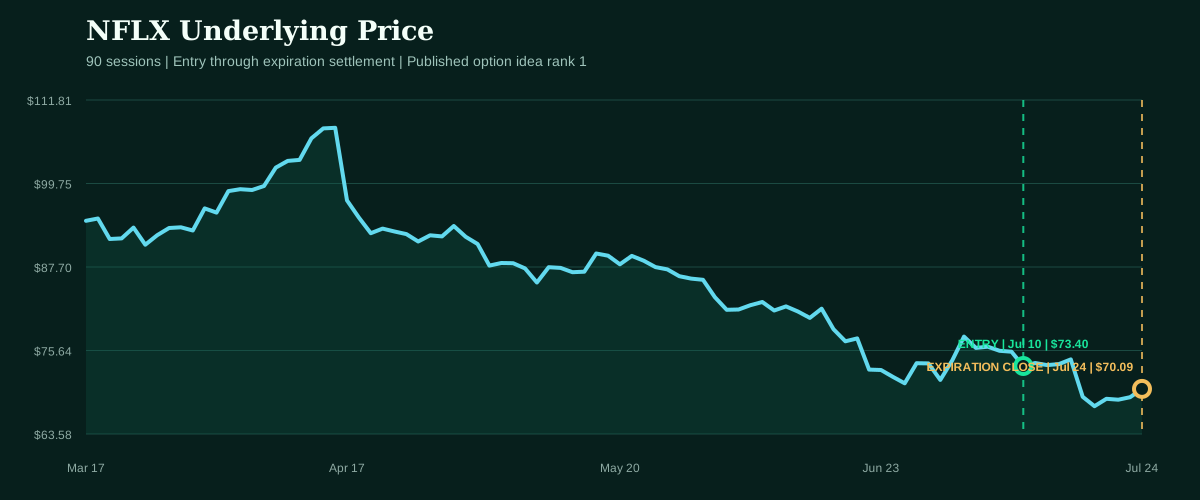
Underlying entry $73.40 on Jul 10, 2026; expiration close $70.09 on Jul 24, 2026.
History260 sessions
RSI (14)41.2
MACD spread+0.72%
ATR (14)3.7%
Realized vol.41.9%
ATM implied vol.57.9%
Expected move9.0%
Risk read
Maximum one-lot loss is $70.00. Breakeven is $76.30 and sits 4.0% above the source mark, providing an upside cushion. Primary watch: a directional break before expiration. A break in the stated directional regime invalidates the reason for holding even when the contractual maximum loss remains unchanged.
2
Actionable watch | consumer and communications demand
T 7/24 21.5/22 Call Credit Spread
RFDELTA score46.72
Credit entry0.15
Prob. profit63.7%
Max loss$35.00
Max profit$15.00
Breakeven$21.65
Reward / risk0.43x
Why it ranks
The setup scores 46.72 on the common scale, supported by 63.7% modeled probability of profit, 0.82 liquidity quality and a conservative modeled expectancy of -$2.02, which keeps sizing discipline central.
T enters with +2.7% five-session momentum and -9.0% over twenty sessions. Realized volatility is 33.7%, placing the underlying in a mean reversion regime. The bearish structure expresses that tape without allowing the loss to expand beyond the spread debit or defined credit width.
Trade construction
Buy the 22 call and sell the 21.5 call, both expiring Jul 24, 2026. The credit mark of 0.15 assumes the long ask and short bid, not a midpoint. Do not accept less than 0.15 of credit without rerunning the payoff.
Maximum one-lot profit is $15.00, or 0.43 times maximum risk. The simulation assigns 60.0% probability to finishing near maximum profit and uses 37.4% implied volatility across deterministic jump-stress paths.
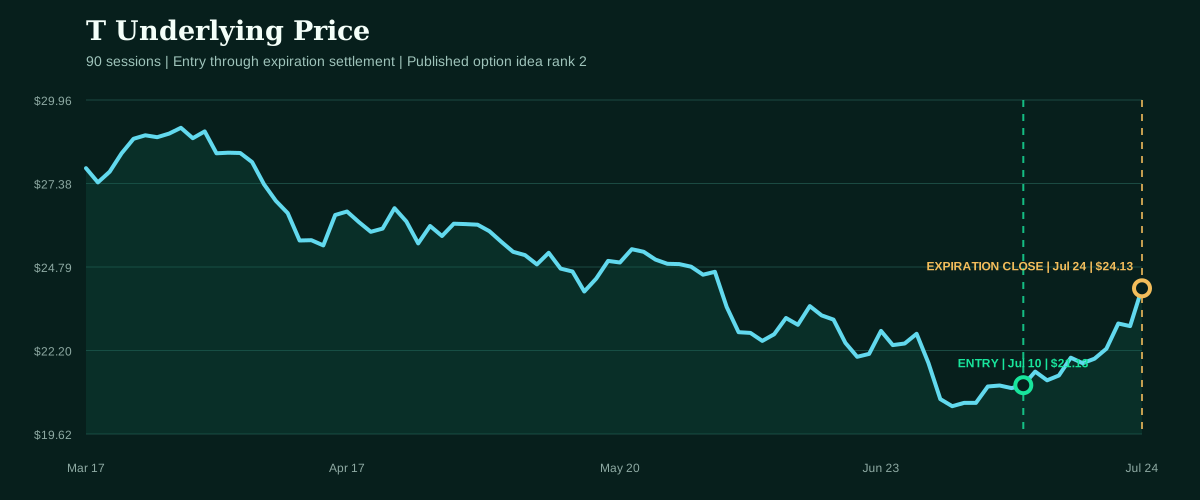
Underlying entry $21.13 on Jul 10, 2026; expiration close $24.13 on Jul 24, 2026.
History260 sessions
RSI (14)40.5
MACD spread+0.10%
ATR (14)3.4%
Realized vol.33.7%
ATM implied vol.38.3%
Expected move6.0%
Risk read
Maximum one-lot loss is $35.00. Breakeven is $21.65 and sits 2.5% above the source mark, providing an upside cushion. Primary watch: a directional break before expiration. A break in the stated directional regime invalidates the reason for holding even when the contractual maximum loss remains unchanged.
3
Trigger-dependent setup | financial and digital-market structure
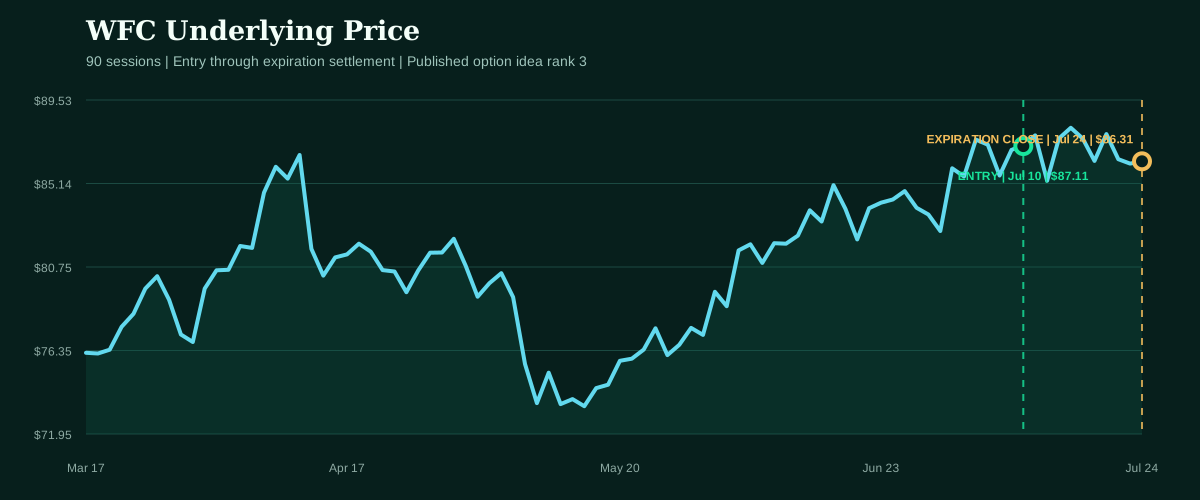
WFC 7/24 85/84 Put Credit Spread
RFDELTA score43.48
Credit entry0.22
Prob. profit64.1%
Max loss$78.00
Max profit$22.00
Breakeven$84.78
Reward / risk0.28x
Why it ranks
The setup scores 43.48 on the common scale, supported by 64.1% modeled probability of profit, 0.78 liquidity quality and a conservative modeled expectancy of -$12.12, which keeps sizing discipline central.
WFC enters with +1.9% five-session momentum and +6.3% over twenty sessions. Realized volatility is 24.7%, placing the underlying in a trend regime. The bullish structure expresses that tape without allowing the loss to expand beyond the spread debit or defined credit width.
Trade construction
Buy the 84 put and sell the 85 put, both expiring Jul 24, 2026. The credit mark of 0.22 assumes the long ask and short bid, not a midpoint. Do not accept less than 0.22 of credit without rerunning the payoff.
Maximum one-lot profit is $22.00, or 0.28 times maximum risk. The simulation assigns 62.8% probability to finishing near maximum profit and uses 38.2% implied volatility across deterministic jump-stress paths.
Underlying entry $87.11 on Jul 10, 2026; expiration close $86.31 on Jul 24, 2026.
History260 sessions
RSI (14)67.9
MACD spread+0.13%
ATR (14)2.2%
Realized vol.24.7%
ATM implied vol.36.5%
Expected move5.7%
Risk read
Maximum one-lot loss is $78.00. Breakeven is $84.78 and sits 2.7% below the source mark, providing a downside cushion. Primary watch: negative conservative BS edge. A break in the stated directional regime invalidates the reason for holding even when the contractual maximum loss remains unchanged.
4
Trigger-dependent setup | long-duration rates
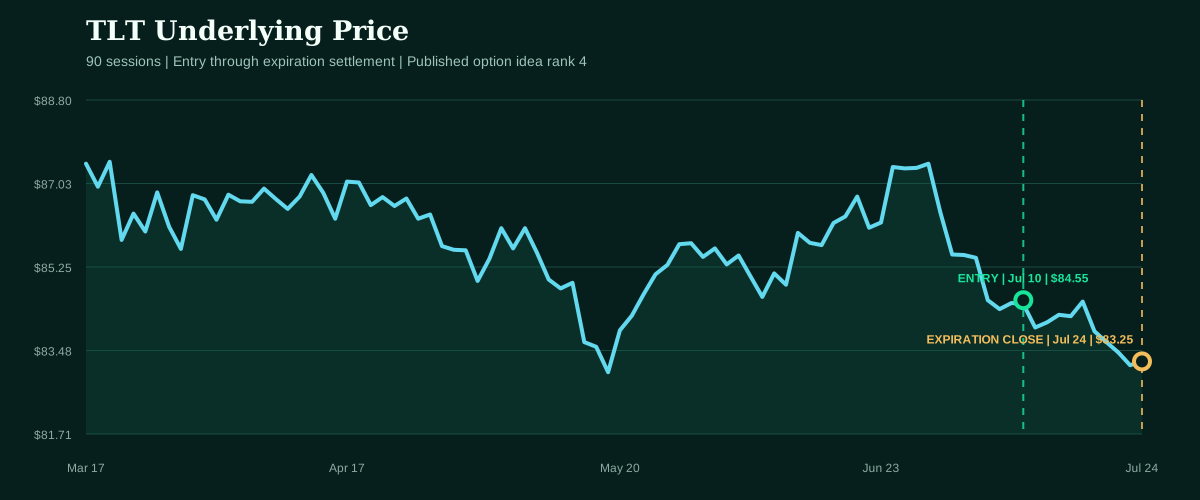
TLT 7/24 85/84.5 Put Debit Spread
RFDELTA score37.88
Debit entry0.29
Prob. profit51.1%
Max loss$29.00
Max profit$21.00
Breakeven$84.71
Reward / risk0.72x
Why it ranks
The setup scores 37.88 on the common scale, supported by 51.1% modeled probability of profit, 0.88 liquidity quality and a conservative modeled expectancy of -$3.16, which keeps sizing discipline central.
TLT enters with -1.1% five-session momentum and -0.4% over twenty sessions. Realized volatility is 10.6%, placing the underlying in a mixed regime. The bearish structure expresses that tape without allowing the loss to expand beyond the spread debit or defined credit width.
Trade construction
Buy the 85 put and sell the 84.5 put, both expiring Jul 24, 2026. The debit mark of 0.29 assumes the long ask and short bid, not a midpoint. Do not pay more than 0.29 for the spread without rerunning the payoff.
Maximum one-lot profit is $21.00, or 0.72 times maximum risk. The simulation assigns 48.3% probability to finishing near maximum profit and uses 18.0% implied volatility across deterministic jump-stress paths.
Underlying entry $84.55 on Jul 10, 2026; expiration close $83.25 on Jul 24, 2026.
History260 sessions
RSI (14)29.5
MACD spread-0.33%
ATR (14)0.7%
Realized vol.10.6%
ATM implied vol.8.1%
Expected move1.3%
Risk read
Maximum one-lot loss is $29.00. Breakeven is $84.71 and sits 0.2% above the source mark, providing an upside cushion. Primary watch: a directional break before expiration. A break in the stated directional regime invalidates the reason for holding even when the contractual maximum loss remains unchanged.
5
Trigger-dependent setup | defense software and AI
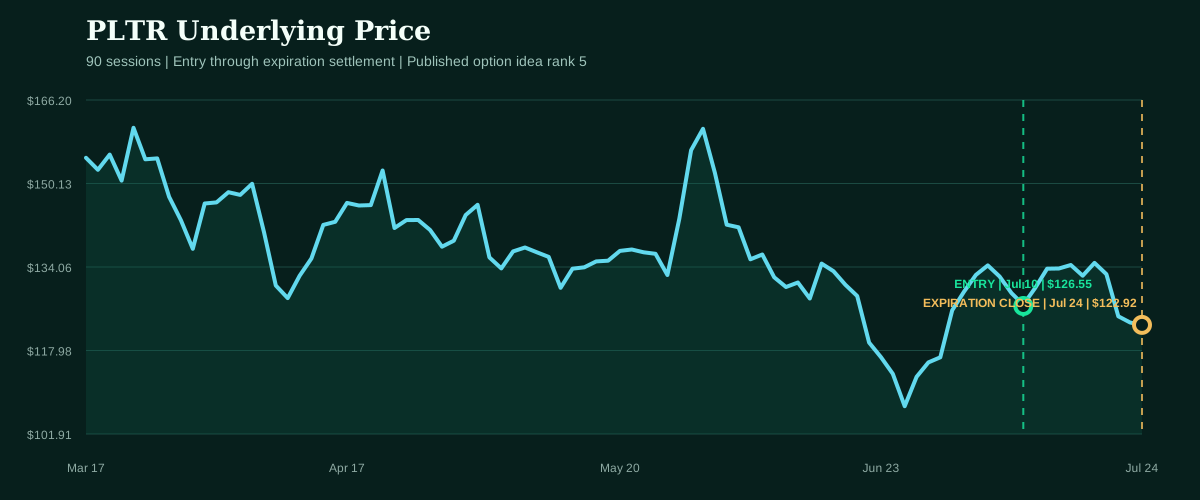
PLTR 7/24 125/120 Put Debit Spread
RFDELTA score36.57
Debit entry1.87
Prob. profit40.1%
Max loss$187.00
Max profit$313.00
Breakeven$123.13
Reward / risk1.67x
Why it ranks
The setup scores 36.57 on the common scale, supported by 40.1% modeled probability of profit, 0.86 liquidity quality and positive modeled expectancy of $3.11.
PLTR enters with -2.1% five-session momentum and -2.8% over twenty sessions. Realized volatility is 58.1%, placing the underlying in a risk off regime. The bearish structure expresses that tape without allowing the loss to expand beyond the spread debit or defined credit width.
Trade construction
Buy the 125 put and sell the 120 put, both expiring Jul 24, 2026. The debit mark of 1.87 assumes the long ask and short bid, not a midpoint. Do not pay more than 1.87 for the spread without rerunning the payoff.
Maximum one-lot profit is $313.00, or 1.67 times maximum risk. The simulation assigns 30.3% probability to finishing near maximum profit and uses 50.4% implied volatility across deterministic jump-stress paths.
Underlying entry $126.55 on Jul 10, 2026; expiration close $122.92 on Jul 24, 2026.
History260 sessions
RSI (14)48.3
MACD spread+1.29%
ATR (14)5.6%
Realized vol.58.1%
ATM implied vol.49.1%
Expected move7.7%
Risk read
Maximum one-lot loss is $187.00. Breakeven is $123.13 and requires a 2.7% decline from the source mark. Primary watch: a directional break before expiration. A break in the stated directional regime invalidates the reason for holding even when the contractual maximum loss remains unchanged.
Completed basket review
Jul 10, 2026 basket closes with $59.00 final P/L
The 5-trade basket finished with 4 wins, 0 near-breakeven results and 1 loss. The modeled one-lot portfolio produced a gain of $59.00, equal to +14.8% of the maximum capital at risk.
NFLX 7/24 76/77 Call Credit Spread was the strongest contributor at $30.00. T 7/24 21.5/22 Call Credit Spread was the largest detractor at -$35.00.
What worked: call credit, put credit, put debit. What needs tighter gating: call credit.
4 wins0 near breakeven1 losses$59 final P/L
NFLX 7/24 76/77 Call Credit Spreadwin
NFLX closed at $70.09 for expiration settlement, producing $30.00 on the one-lot spread.
$30
T 7/24 21.5/22 Call Credit Spreadloss
T closed at $24.13 for expiration settlement, producing -$35.00 on the one-lot spread.
-$35
WFC 7/24 85/84 Put Credit Spreadwin
WFC closed at $86.31 for expiration settlement, producing $22.00 on the one-lot spread.
$22
TLT 7/24 85/84.5 Put Debit Spreadwin
TLT closed at $83.25 for expiration settlement, producing $21.00 on the one-lot spread.
$21
PLTR 7/24 125/120 Put Debit Spreadwin
PLTR closed at $122.92 for expiration settlement, producing $21.00 on the one-lot spread.
$21
Accountability ledger
Every prior basket, one expanding record
Open positions remain visible beside completed baskets, preserving the original trade terms and the final modeled expiration result for each published day.
June 19, 2026Historical calibration editioncomplete5 resolved / 0 open-$147
The Jun 19, 2026 basket has 1 win, 0 near-breakeven results and 4 losses across 5 resolved spreads, for modeled one-lot expiration P/L of -$147.00. All listed positions are resolved.
1 wins0 near breakeven4 losses0 still open
MARA 7/3 13/12.5 Put Credit Spreadloss
MARA closed at $12.40 for expiration settlement, producing -$39.00 on the one-lot spread.
-$39
SMCI 7/3 28/27 Put Credit Spreadloss
SMCI closed at $27.22 for expiration settlement, producing -$57.00 on the one-lot spread.
-$57
RGTI 7/3 19.5/19 Put Credit Spreadloss
RGTI closed at $17.94 for expiration settlement, producing -$38.00 on the one-lot spread.
-$38
QUBT 7/3 10.5/10 Put Debit Spreadwin
QUBT closed at $9.05 for expiration settlement, producing $24.00 on the one-lot spread.
$24
SOFI 7/3 17.5/16.5 Put Debit Spreadloss
SOFI closed at $18.24 for expiration settlement, producing -$37.00 on the one-lot spread.
-$37
Daily Market Read
The board is selling optimism, but only with defined risk
Today's 5-spread board is defensively tilted: 1 bullish and 4 bearish expressions, 56.7% average modeled probability of profit and $399 of aggregate one-lot maximum risk. Across 2 retained market boards, directional balance has moved more defensive; the top score is -2.94 points versus the prior-board average and modeled win probability is -0.5 percentage points.
The market can look calm at index level while the option chain tells a less comfortable story. The published names carry -0.8% average five-session momentum and cluster most heavily in a risk off regime. That is not a blanket vote on the market; it is a warning that the day's best-defined payoffs are selective rather than broad.
No current leader repeats from the available prior boards. Rotation is doing more work than durable leadership, and that is usually where chasing yesterday's winner becomes expensive. The top score sits at 52.76, while the basket's expected value totals -$19 under conservative bid-and-ask entries. A ranking that cannot absorb the spread between theory and execution does not belong on the public board.
Average implied volatility is 40.9% against 33.8% realized volatility. The premium is visible, but expensive options are not automatically good shorts; the spread still has to survive direction and path. The structure mix is 3 credit and 2 debit spreads, so the board is neither blindly buying convexity nor mechanically selling premium. It is paying only where direction can justify the bill and collecting only where the strikes leave room for error.
The price-and-options evidence carries the read today. A risk off regime with -0.8% mean five-session momentum leaves less room for narrative-first trading; confirmation has to appear in breadth, volatility and follow-through.
What to watch
Breadth confirmation1 bullish / 4 bearish; -0.8% mean five-session move
Defensive skew needs downside follow-through. A fast reversal above entry regimes would invalidate the premise before contractual risk is reached.
Volatility spread40.9% implied vs 33.8% realized
Watch whether implied volatility expands with price movement or collapses after the opening catalyst. That relationship decides whether direction alone is enough.
Leadership durabilityNo repeat leader in the current board
Rapid rotation argues for smaller assumptions and harder entry limits. New leadership has not yet earned persistence.
Use the first reaction as evidence, not proof. The board requires price and options confirmation before a headline becomes a durable thesis.
Risk budget$399 maximum one-lot basket loss (+$180 vs prior average)
Maximum losses are additive. Correlated names can fail together even when each spread is individually defined, so basket risk matters more than the comfort of any single cap.
Rolling comparison uses 2 retained published market sessions: Jul 10, 2026, Jun 19, 2026. The current screen ranked 25 candidates across 40 included symbols. Headline ranking uses publication time, market relevance, source quality, symbol relevance and topic diversity. Market evidence is timestamped Jul 11, 2026, 6:38 AM EDT. RFDELTA Top Option Trades is market intelligence, not individualized investment advice. Options can expire worthless, spreads can be assigned early, and displayed quotes may move before an order can be filled.
Why it ranks
The setup scores 52.76 on the common scale, supported by 64.7% modeled probability of profit, 0.95 liquidity quality and a conservative modeled expectancy of -$4.51, which keeps sizing discipline central.
NFLX enters with -5.5% five-session momentum and -10.5% over twenty sessions. Realized volatility is 41.9%, placing the underlying in a risk off regime. The bearish structure expresses that tape without allowing the loss to expand beyond the spread debit or defined credit width.
Trade construction
Buy the 77 call and sell the 76 call, both expiring Jul 24, 2026. The credit mark of 0.30 assumes the long ask and short bid, not a midpoint. Do not accept less than 0.30 of credit without rerunning the payoff.
Maximum one-lot profit is $30.00, or 0.43 times maximum risk. The simulation assigns 63.4% probability to finishing near maximum profit and uses 60.5% implied volatility across deterministic jump-stress paths.